We had a busy summer and concluded it with great success! Our latest release includes a handful of really useful enhancements, but we’d like to highlight two.
- Improved reporting & dashboards
- More efficient design controls
Improved reporting & dashboards
A big advantage of Shibumi is how we allow you to organize your information any way you like, in any hierarchy that makes sense. Shibumi is completely flexible, and our customers have taken advantage of this. Everything from simple Program -> Initiative structures to complex multi-level, matrixed structures. But one thing had always been difficult: reporting across the full hierarchy.
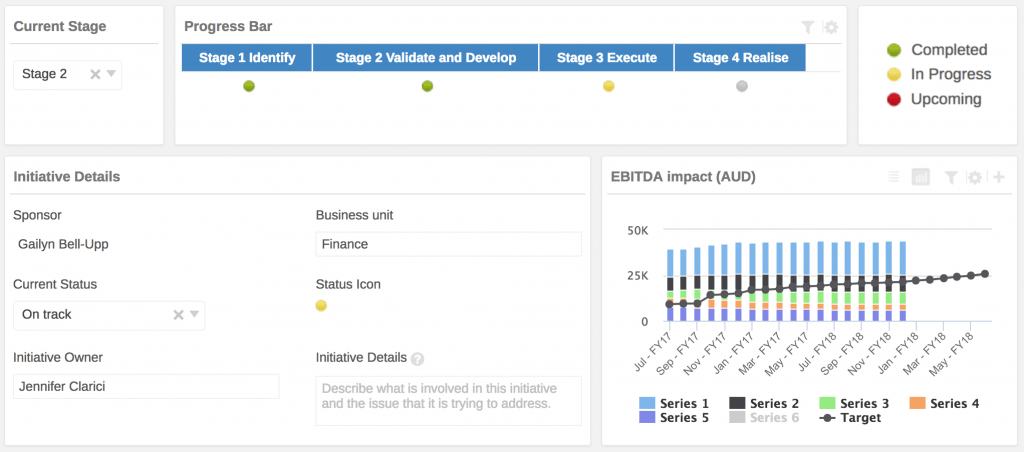
Let’s take, for example, a structure like Portfolio -> Program -> Initiative -> Milestone -> Activity. We see that there are five levels in this structure. Generating a view that includes information from all five levels has historically been difficult. But not anymore. We now allow you to generate reports and views that include any level of information.

Building off the ability to pull in data from any level of the hierarchy is to include it in advanced charts and graphs. With our metric timeframe views, you can quickly add data over time, for instance, monthly data over a year, add any columns of data from the hierarchy, and group the information into logical buckets. The chart will now respect your groups and add them as stacks in the bar chart. This functionality makes it really easy to flip perspectives and slice the data in any way.

Both of these features make it much easier to analyze and identify trends in your data and allow stakeholders to make better and more informed decisions.
More efficient design controls
A big part of what makes Shibumi so powerful is how simple it is to get data into the system. With our auto-save features, copy and paste from Excel, bulk edit, and others, adding data is a snap. But, as we’ve heard from customers, they’d like more control over the layout of their forms to make more efficient use of screen real estate. We heard you and love how you think! So, we now offer more layout controls of your forms. Place the form anywhere within a page, size it to your liking, and set the location of the field labels. This allows you to create beautiful page layouts that can include forms, charts, and tables in a single view.

* Bonus item for our customers down under!
For some of our larger customers, data sovereignty is a critical issue. For those in Australia, we’ve added a data center in the country.
As always, keep the feedback coming. For more information, ask your Shibumi admin or connect with us directly!